Last Updated January 27, 2026
Small businesses play a critical role in our local and global economies, but it can be difficult to make informed business decisions without having benchmarks or statistics to base your decisions on. We have put together some key small business revenue statistics to give business owners an idea of how their companies stack up against national averages and trends.
Small Businesses Make Up 99.9% of All U.S. Businesses
Small businesses are the backbone of our economy, making up 99.9% of all business nationwide. In total, 61.6 million Americans work for a small business, making up an astonishing 45.9% of the total workforce.
Average Small Business Owner Salary
According to PayScale, the average small business owner takes home a salary of $76,905 per year. However, this figure varies greatly on a case-by-case basis, as the top 10% of owners make more than $178,000 annually while the bottom 10% makes $36,000 or less per year.
Note that there is quite a bit of variance from source to source regarding small business owner salary statistics. For example, Zippia reports that the average business owner salary is $50,934 per year, while Comparably reports the average small business owner makes $80,553 per year. Even still, ZipRecruiter reports an average salary of $127,973 for small business owners.
Nonemployer Business Statistics
A nonemployer business is one that has no paid employees except for the business owner, and according to census.gov, there were 30.4 million nonemployer businesses nationwide in 2023.
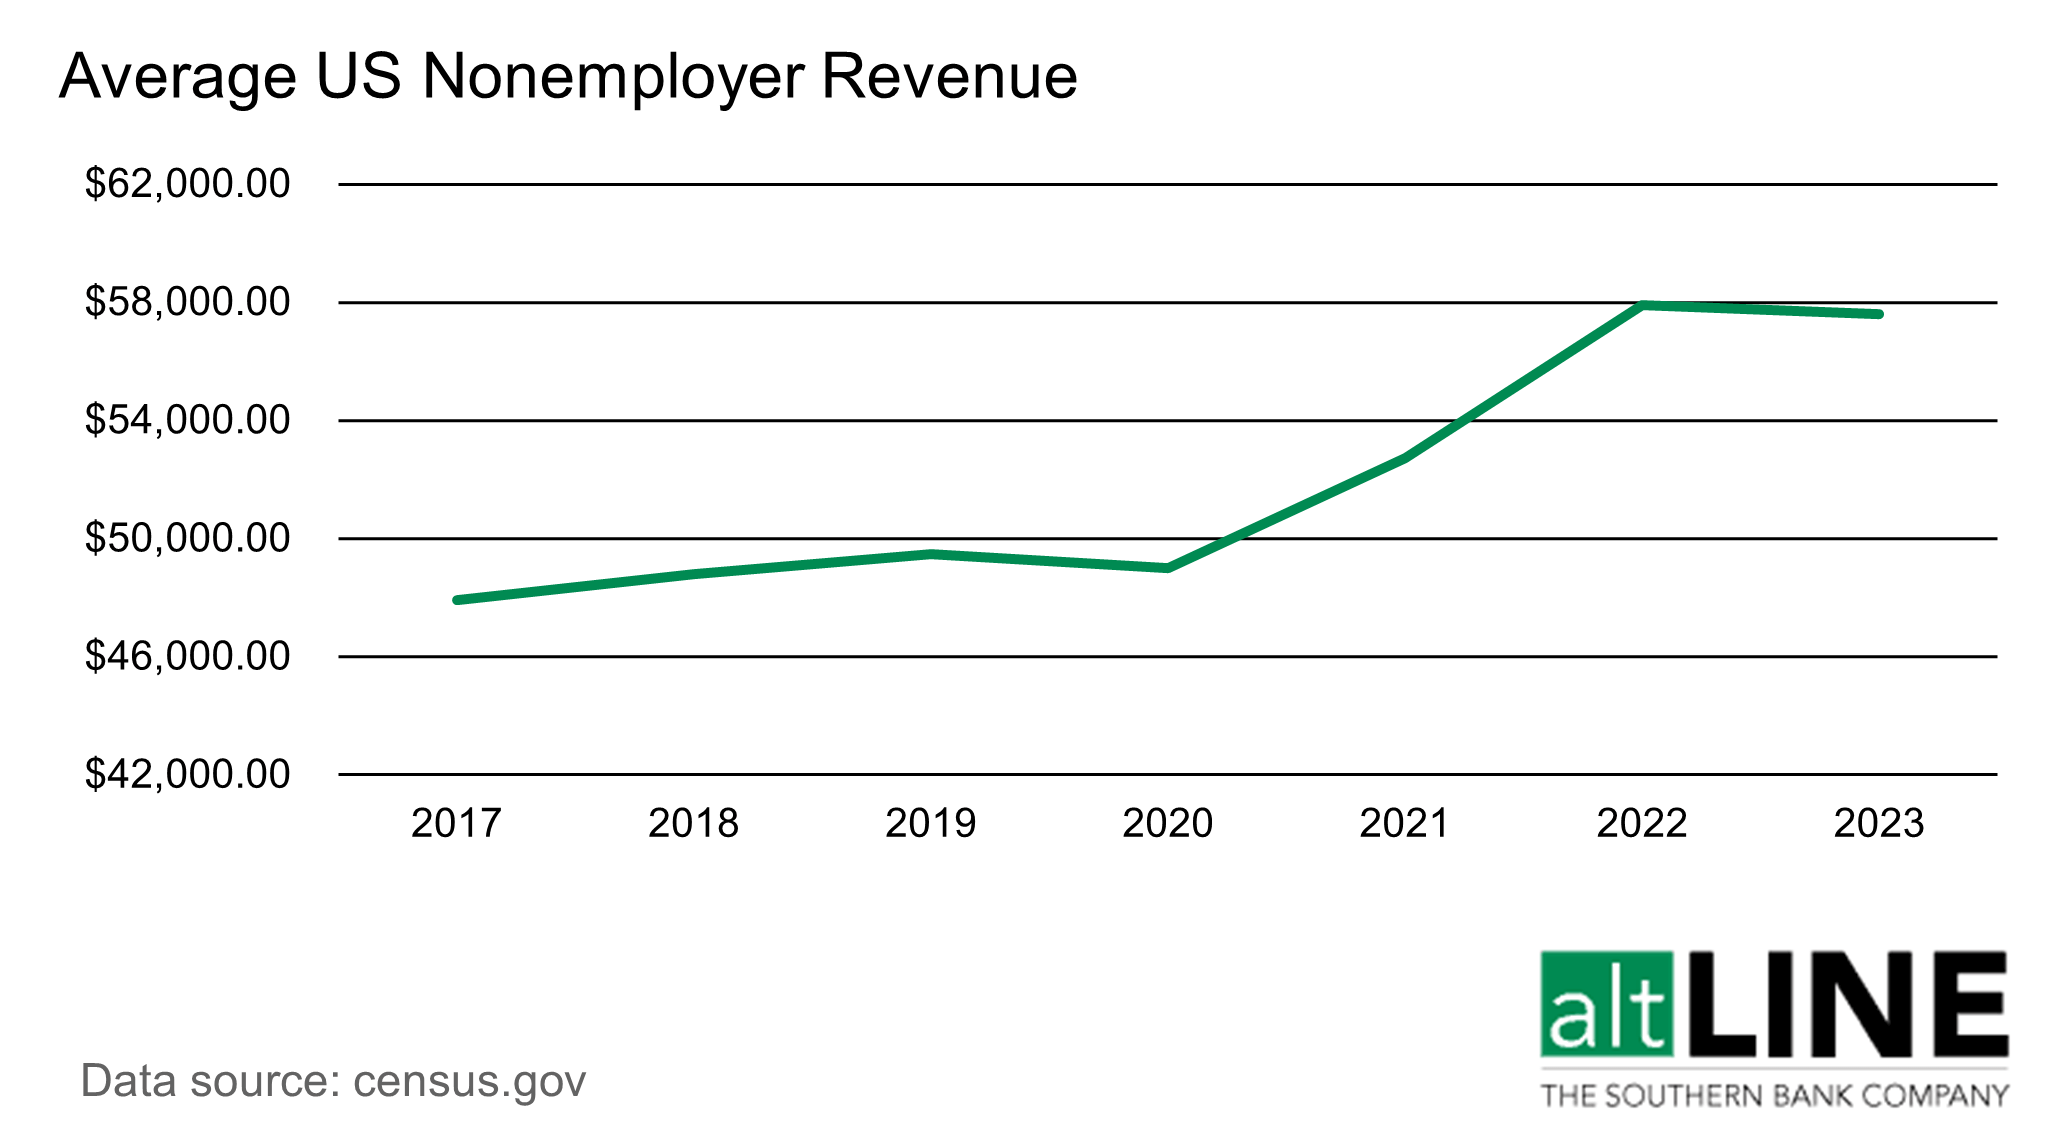
Average Annual Revenue for U.S. Nonemployer Businesses
Based on data from census.gov, the average revenue for a US nonemployer establishment was $57,611 in 2023, up 17.5% from 2020.
Additionally, there is quite a bit of variation in the average revenue of establishments by industry. For example, businesses in the wholesale trade industry bring in 135.8% more revenue, on average, compared to the overall nonemployer firm average. Other higher earning industries include real estate, rental, and leasing (88.5%) and finance and insurance (75.5%).
Some industries earn well below the overall average, including educational services (-68.2%) and administrative, support, and waste management (-50.1%).
| Industry | Average Revenue | Compared to the Overall Nonemployer Average |
|---|---|---|
| Wholesale trade | $135,845 | 135.8% |
| Real estate and rental and leasing | $108,586 | 88.5% |
| Finance and insurance | $101,136 | 75.5% |
| Utilities | $98,441 | 70.9% |
| Mining, quarrying, and oil and gas extraction | $94,897 | 64.7% |
| Construction | $84,315 | 46.4% |
| Retail trade | $64,084 | 11.2% |
| Agriculture, forestry, fishing and hunting | $58,430 | 1.4% |
| Manufacturing | $58,159 | 1.0% |
| Professional, scientific, and technical services | $57,479 | -0.2% |
| Transportation and warehousing | $45,200 | -21.5% |
| Information | $44,848 | -22.2% |
| Health care and social assistance | $41,576 | -27.8% |
| Accommodation and food services | $39,067 | -32.2% |
| Other services (except public administration) | $38,030 | -34.0% |
| Arts, entertainment, and recreation | $34,209 | -40.6% |
| Administrative and support and waste management and remediation services | $28,729 | -50.1% |
| Educational services | $18,322 | -68.2% |
76% of US Nonemployer Establishments Make Less than $50,000 in Annual Revenue
Even though the average nonemployer revenue is $57,611, three fourths of nonemployer establishments make less than $50,000 per year (census.gov).
However, there is still an opportunity to bring in quite a bit of revenue as a nonemployer business; 13.3% of nonemployers bring in six figures or more per year.
| Annual Revenue | Number of Establishments | Percent of Establishments |
|---|---|---|
| > $1,000,000 | 117,060 | 0.4% |
| $500,000 – $999,999 | 411,602 | 1.4% |
| $250,000 – $499,999 | 891,905 | 2.9% |
| $100,000 – $249,999 | 2,609,855 | 8.6% |
| $50,000 – $99,999 | 3,425,808 | 11.3% |
| < $50,000 | 22,971,578 | 75.5% |
| TOTAL ESTABLISHMENTS | 30,427,808 | 100.0% |
When breaking down the nonemployer average revenue by entity type, we found that sole proprietorships make $40,352, on average, which is 30% less than the overall nonemployer average. On the flipside, nonemployer S-corporations, partnerships, C-corporations, and other corporate legal forms of organization each make more than $160,000 in revenue, on average, per year.
Over Half of Nonemployer Firms Expect Revenue to Increase in the Next 12 Months
According to the Fed Small Business, 37% of nonemployer firms saw decreased revenue compared to the previous 12 months, while 34% saw increased revenue. However, 64% of nonemployer firms expect revenue to increase in the next 12 months.
The most commonly cited financial challenge for nonemployer firms was the increased cost of goods, services, and/or wages, with 55% of all nonemployer firms noting this as a challenge. Weak sales followed close behind with 47% citing it as a financial issue. Other financial challenges reported included uneven cash flow (44%), credit availability (31%), and making payments on debt/interest rates (30%).
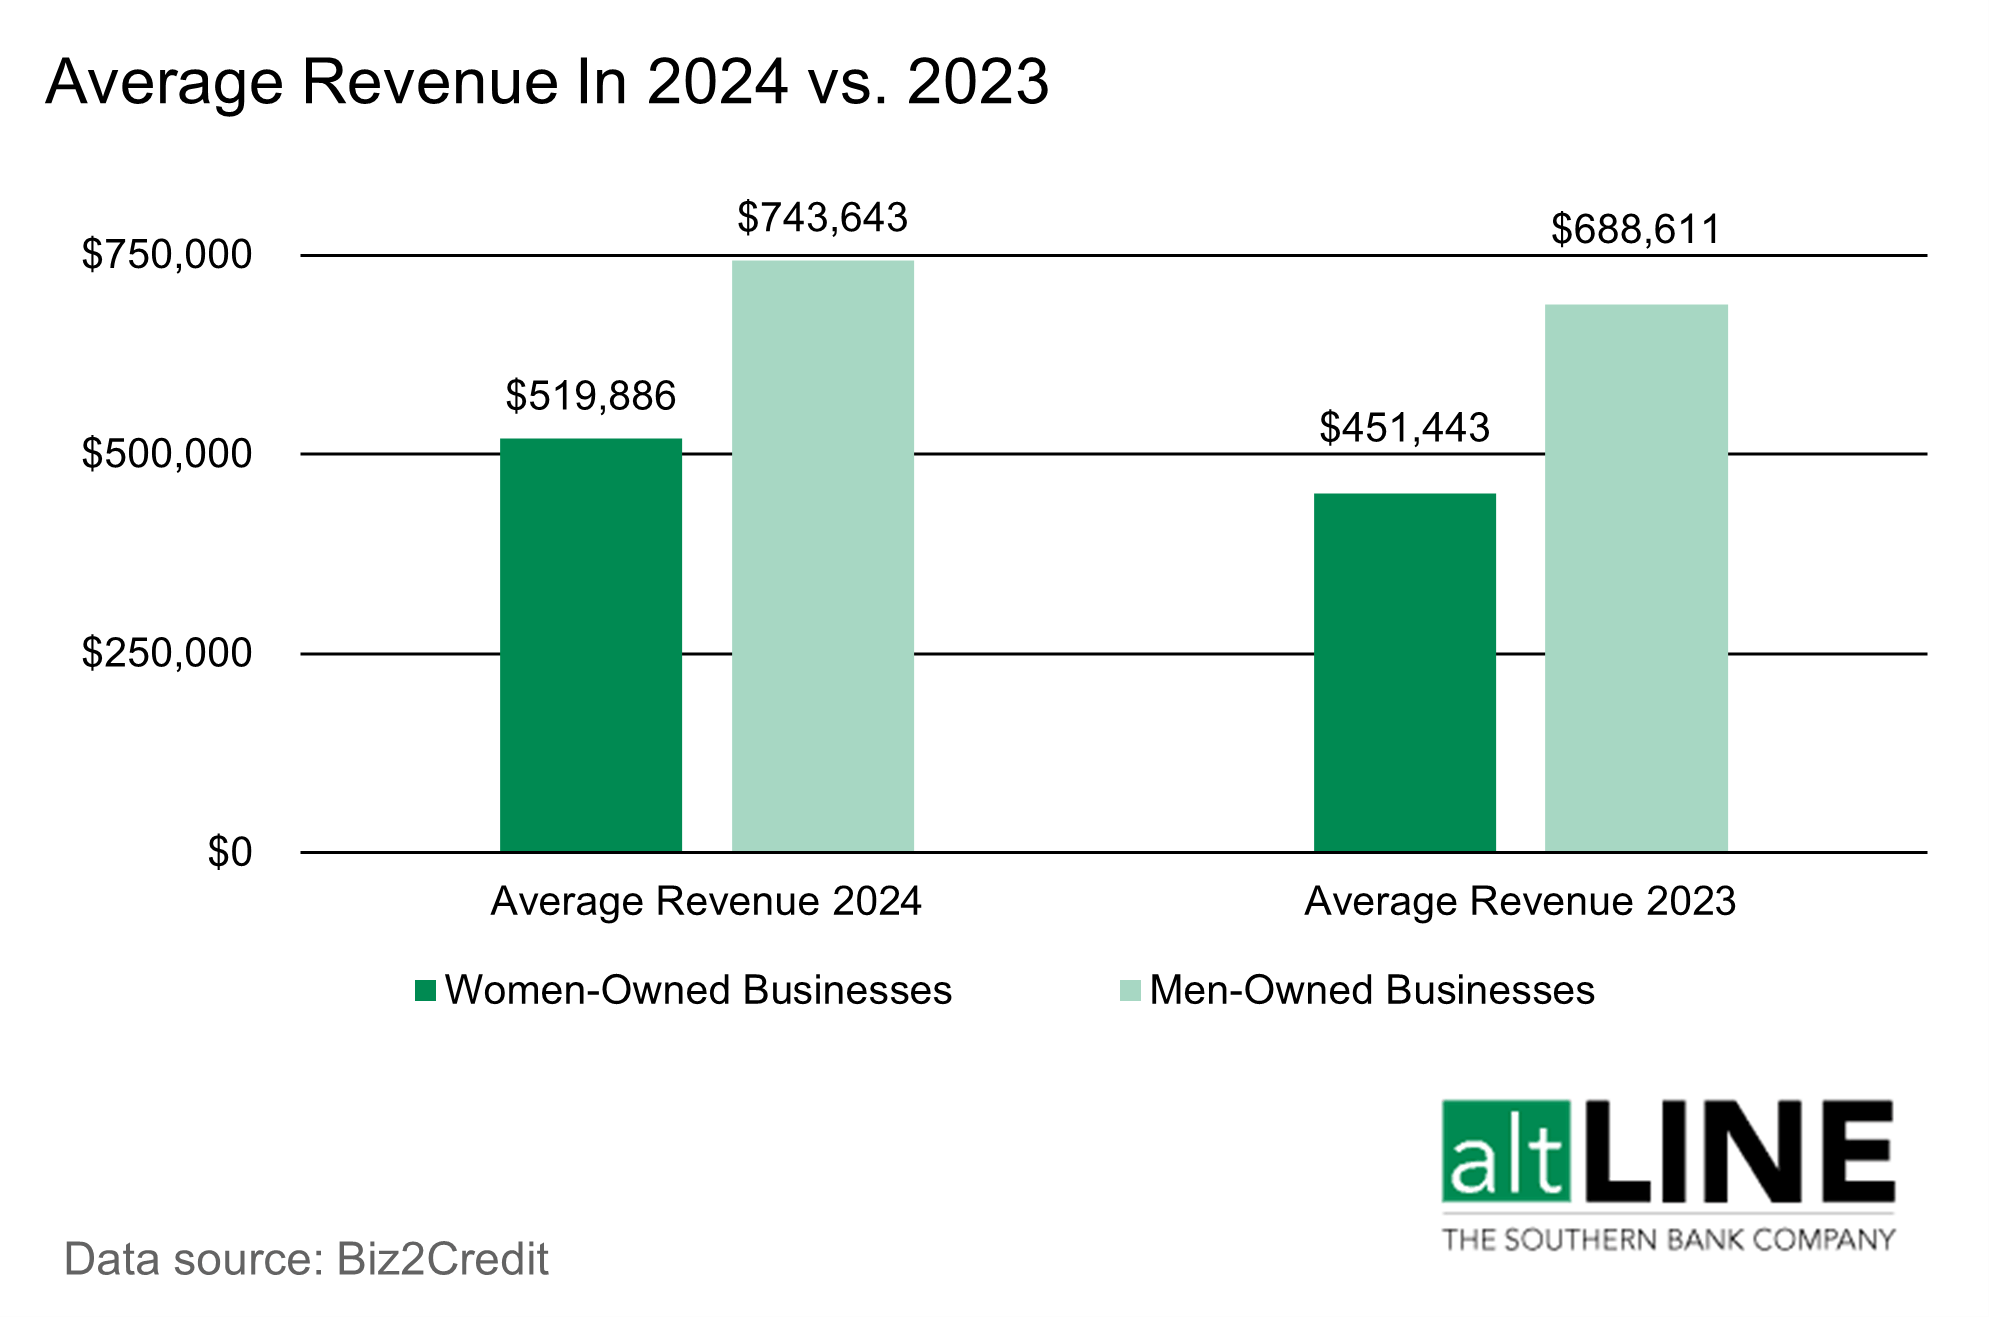
Women-Owned Businesses Make 30% Less Revenue Than Male-Owned Businesses
Small and medium-sized businesses owned by women earned, on average, 30% less revenue in 2024 compared to men-owned businesses ($519,886 vs. $743,643), according to Biz2Credit. However, women-owned businesses saw a larger year-over-year increase in revenue of 15.2% compared to 8.0% for men-owned businesses.
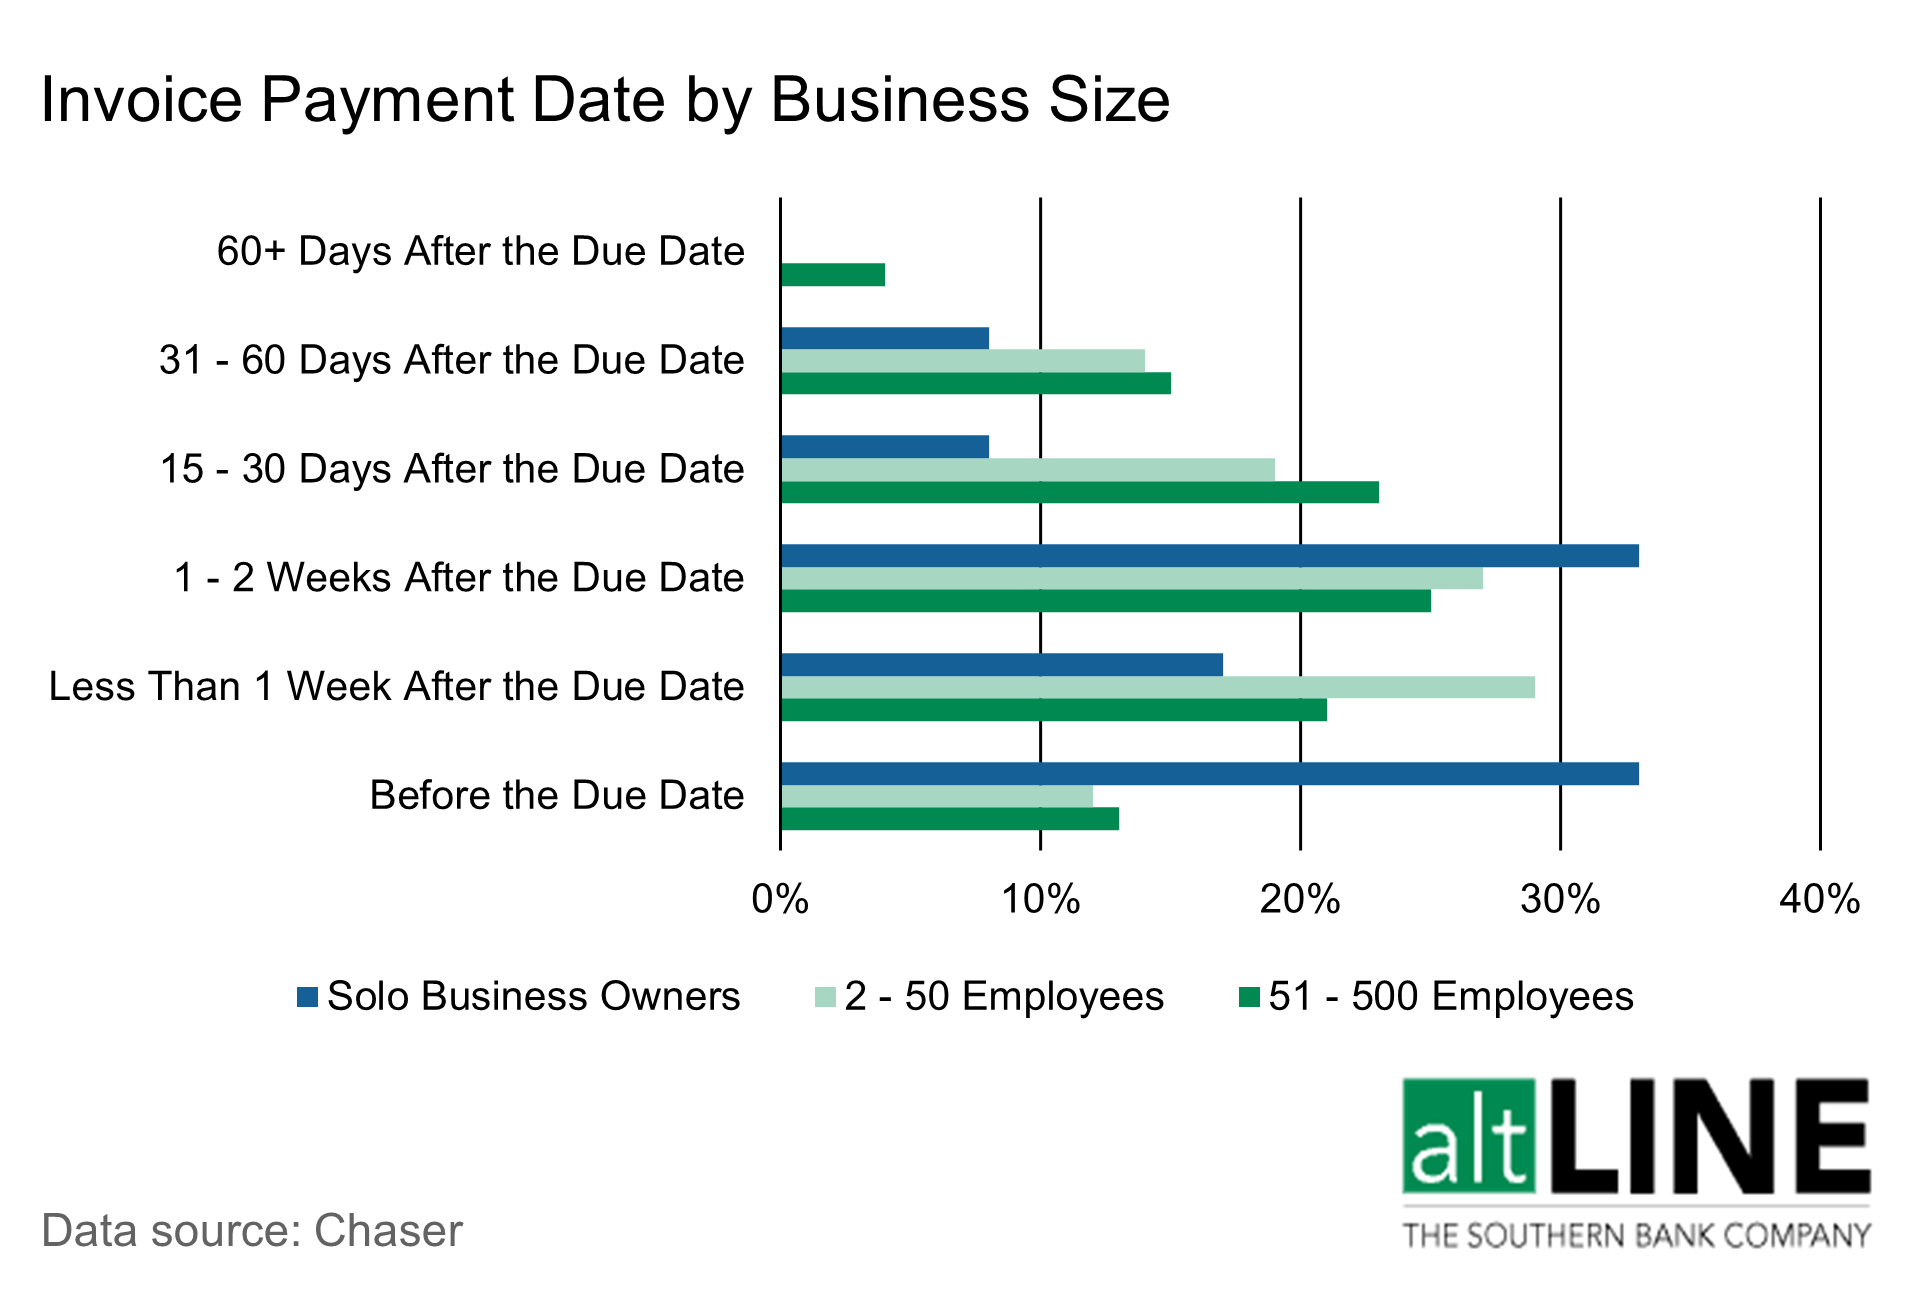
On Average, Small Businesses Are Paid 1 – 2 Weeks After the Invoice Due Date
Late invoice payments can be detrimental to small businesses, and according to Chaser, small businesses are paid more often than not after the invoice due date. Solo business owners are most likely to get paid prior to the invoice due date, while companies between 2 and 50 people are least likely to get paid on time amongst small businesses.
Additionally, according to QuickBooks, 56% of surveyed small business owners were owed money from unpaid invoices, and the small businesses most impacted by past due invoices were 1.4x more likely to report cash flow problems.
Cash Flow Is the No. 1 Reason Why Small Businesses Fail
Small business survival rates are always a point of interest when starting a new business. According to the Small Business Administration’s Office of Advocacy, 68% of small businesses survive their first two years, and nearly half survive for at least five years. However, survival rates drop off pretty drastically once businesses reach the decade mark with only 34% surviving at least 10 years and 26% surviving at least 15 years.
The primary reason new businesses fail? 82% of startups cite cash flow problems as the reason for closing (Visual Capitalist). While this can sound intimidating, there are plenty of ways to combat cash flow issues, including:
- Collecting invoice payments as quickly as possible and paying vendors as slowly as possible
- Doing credit checks on your customers to ensure they are creditworthy and increase the likelihood of on-time payments
- Increase working capital through an alternative financing method, such as invoice factoring or freight factoring
- Lease equipment instead of purchasing it outright
- Offer early payment discounts
For more ways to improve cash flow, check out our article.
What Do These Small Business Revenue Statistics Mean for You?
These small business revenue statistics may make starting a company sound daunting, but they are important to review to help you make solid business and financial planning decisions. Starting a business is hard work and modest earnings may deter you, but becoming an entrepreneur can be an incredibly rewarding experience. Now that you are equipped with industry benchmarks and nationwide trends, you are better prepared to enter the entrepreneurial market.
Below are some resources that can help you get started with your small business:
- Ways to Fund a Business Without a Loan
- Cash Flow Risk Management and How to Reduce It
- Cash Flow Management for Small Businesses
- How to Do a Budget Analysis for Your Business
Small Business Revenue Statistics FAQs
What is the average annual revenue for small businesses?
The average annual revenue for small businesses varies significantly, ranging from anywhere between $1 million to $41.5 million per year.
Per Zippia, businesses with 1 – 4 employees bring home $347,000 per year, businesses with 5-9 employees have a return of $1.08 million per year, and businesses with 100-499 employees bring in $40.77 million annually.
What states have the most small businesses?
According to the U.S. Small Business Administration, the states with the most registered small businesses are California (4.3 million), Texas (3.5 million), and Florida (3.5 million).
What are the best states to start a small business in 2026?
The best states to start a small business—based on cost, access to resources, and overall business environment—are Florida, Utah, and Texas.
What states have the most small business growth?
According to the WalletHub, the states with the highest increase in small businesses are Idaho, Utah, and Delaware.
What is the average small business loan size?
The average small business loan size is $458,497, per Bankrate, and the average microloan size from the SBA is $13,000.
What percent of small businesses fail within their first year?
According to the most recent data from the Bureau of Labor Statistics, 22.1% of private sector businesses did not survive their first year.
What is the small business success rate?
The U.S. Bureau of Labor Statistics’ most recent data shows that 77.9% of private sector businesses made it to the 1-year mark, while 34.7% of them made it to the 10-year mark.

Angela is the VP of Marketing at altLINE where she manages content production, marketing and sales operations, and digital PR. Angela joined altLINE in 2022 after several years of working in digital marketing across various industries including financial services and B2B. Angela loves creating content that helps readers better understand their financing options and helps them make informed decisions about factoring. Her work has been featured in publications like Search Engine Journal and Moz.